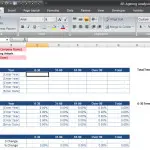
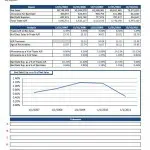
Analyze and evaluate accounts receivable over a 5 year period with this tool. All information can be reviewed graphically over time to provide additional context. Eight key ratios are calculated off of a few inputs. These ratios include Days Sales in Trade AR, AR Turnover, and Bad
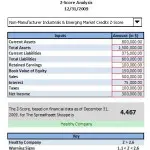
Read more →The Z-Score, also known as the insolvency predictor, can be used to determine the probability of bankruptcy within a period of two years. Simply select the type of company you’re evaluating and complete the inputs. Altman Z-Score Calculator Z-Score History: Altman’s Z-Score originally surfaced in 1968 and
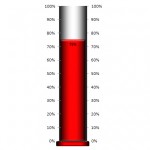
Read more →Excel thermometer Charts can really add visual appeal to an existing dashboard or be used as a standalone graph. Below are four that we’ve created providing several options and showing the versatility of an Excel thermometer chart. All charts are fully functional, meaning the thermometer “fills” based
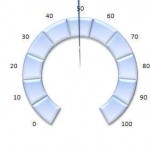
Read more →Excel Speedometer (Speedo) Charts can add visual appeal to an existing dashboard or be used as a stand-alone graph. Below are four that we’ve created providing several options and showing the versatility of an Excel Speedometer Chart. All charts are fully functional, meaning the needle moves based
Read more →Want to know how to make thermometer chart in Excel? We’ll show you how to do this quickly and easily, so you can follow along and create your own. How to make an Excel thermometer chart Step 1 It’s always good to plan ahead. Before starting, determine
Read more →